1

Unseen Perturbations

Predicting cellular responses to perturbations not seen during training

This task evaluates model generalization capabilities by testing predictions on completely novel perturbations, simulating real-world scenarios where new treatments need response prediction.

Task Overview

In Task 1, models are trained on a subset of perturbations and tested on their ability to predict responses to completely unseen perturbations. This represents a critical real-world scenario where researchers need to predict the effects of new drugs or genetic modifications.

Key Challenges:

  • Generalization: Models must learn transferable patterns from seen perturbations
  • Effect Size Dependency: Performance varies significantly with perturbation magnitude
  • Cell Type Specificity: Responses can be highly context-dependent

Evaluation Metrics:

  • Pearson Correlation
  • R-squared
  • Mean Squared Error (MSE)
  • Mean Absolute Error (MAE)
  • Cosine Similarity
Task 1 Results

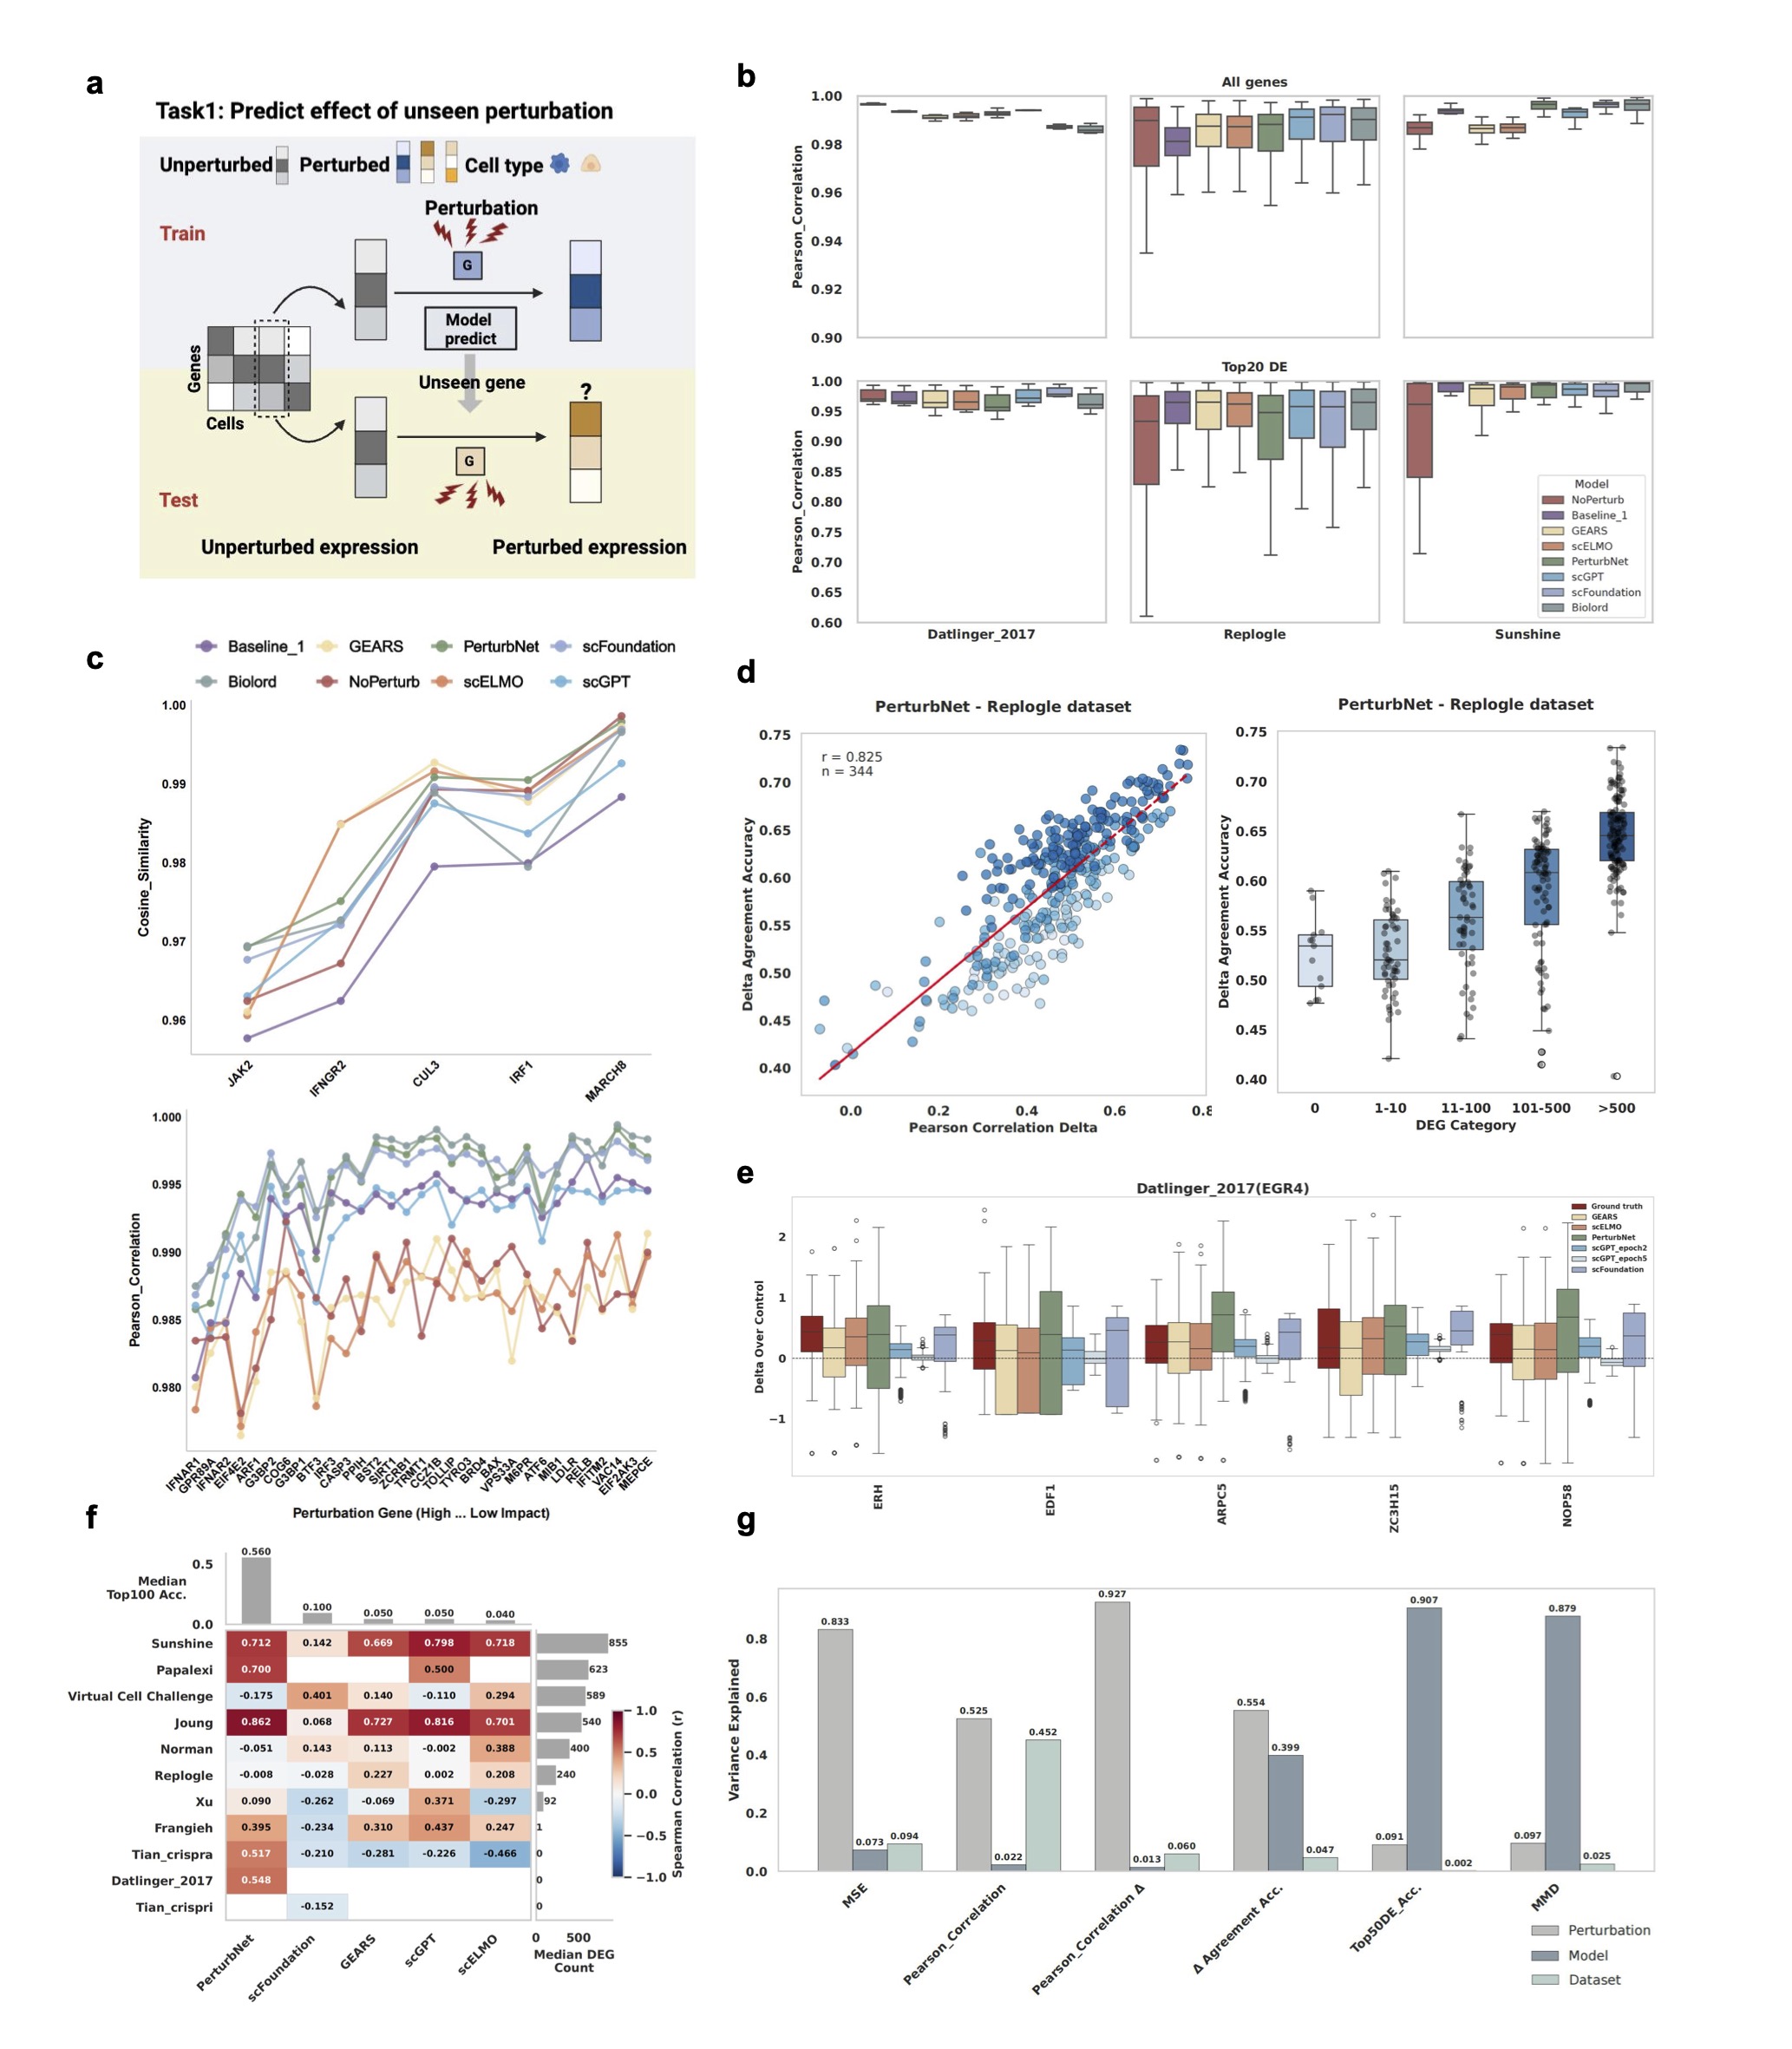
Figure 2: Task 1 performance results showing model comparison across different metrics and effect sizes

Performance Results

Best R²

GEARS
R² = 0.866 average

Best DE Recovery

PerturbNet
56% DE overlap accuracy (paper)

Best Delta Accuracy

Biolord
83.9% direction accuracy

Interactive Performance Visualizations

Delta Performance

Pearson Correlation Delta vs Delta Agreement Accuracy

Key Insights

Effect Size Matters

Performance strongly correlates with perturbation effect size. Stronger perturbations are easier to predict accurately.

Model Architecture Impact

Graph-based models (GEARS, PerturbNet) show superior performance compared to simpler baselines.

Dataset Variability

Performance varies significantly across different datasets, highlighting the importance of dataset characteristics.

Metric Consistency

Models that perform well on correlation metrics often struggle with absolute error measures.