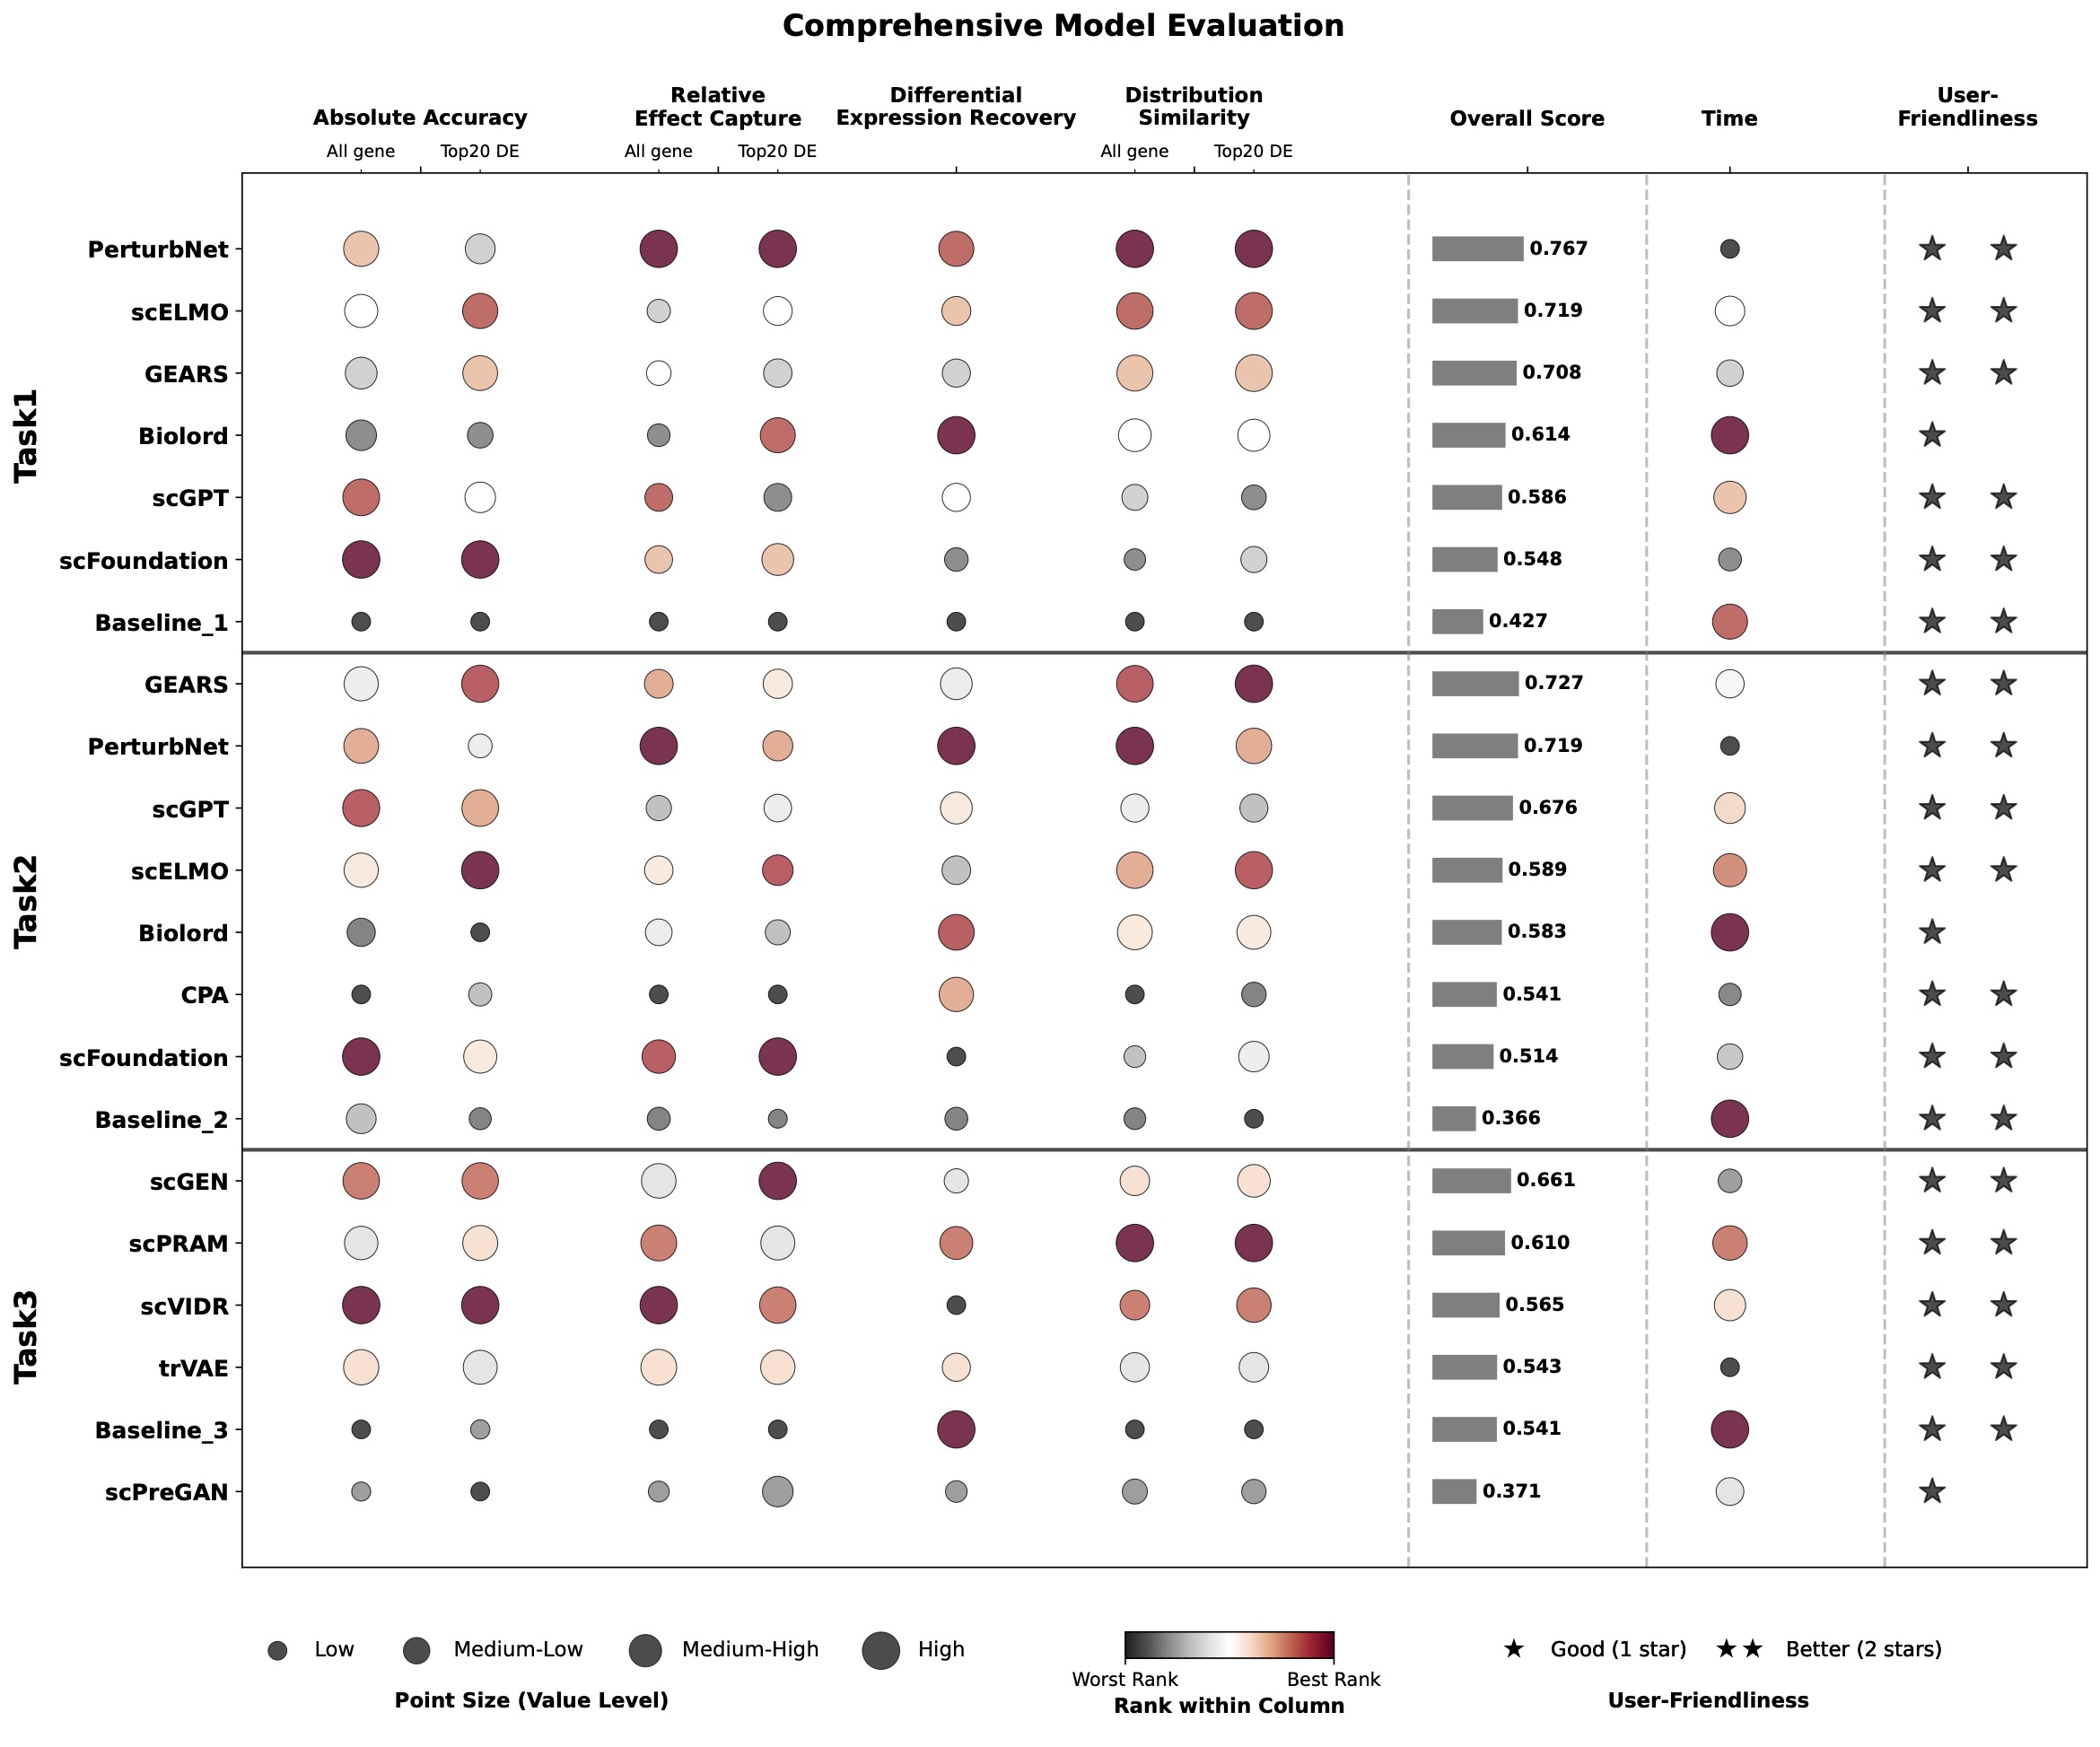
Figure 5: Summary of model performance across all tasks and evaluation metrics
Key findings from comprehensive benchmarking of perturbation prediction models
A systematic comparison of 12 models + 3 baselines reveals that model performance depends strongly on perturbation effect size and evaluation perspective
Figure 5: Summary of model performance across all tasks and evaluation metrics
Model performance ranking shifts dramatically based on perturbation effect size, dataset properties, and evaluation metric. No single model dominates across all scenarios.
Small perturbation effects: Easier to predict with direct expression metrics (R², Pearson correlation)
Large perturbation effects: Better captured by delta-based metrics and differential expression recovery
PerturbNet dominates differential expression recovery (56% overlap accuracy) due to distribution-aware modeling
scGEN performs best for cell transfer, but no method achieves satisfactory DE prediction across cell types
Show variance compression - underestimate response heterogeneity despite large-scale pretraining
Performance variability arises primarily from dataset and perturbation identity rather than model architecture. Cell-type transfer success depends on biological similarity and conserved response programs.
| Scenario | Recommended Model | Reason | Performance |
|---|---|---|---|
| Differential Expression Recovery | PerturbNet | Distribution-aware architecture captures full perturbation effects | 56% DE overlap accuracy |
| General Performance (R²) | GEARS | Gene regulatory network integration | R² = 0.866 (Task 1) |
| Delta Direction Accuracy | Biolord / scFoundation | Effective at capturing perturbation directions | 83.9% / 89.8% accuracy |
| Cell Transfer | scGEN | Best cross-cell-type generalization | R² = 0.772, 88.1% delta accuracy |
| Combinatorial Perturbations | scGPT / GEARS | Handle interaction effects effectively | R² = 0.784 / 0.783 |
Access the source code, datasets, and publication